Applying that same ratio – based on his strike-rate in the Premier League and Champions League this term – the Norwegian would hit a mind-boggling 113 goals if he played every minute this term.
Haaland, who scored an outrageous winner against former club Borussia Dortmund in the Champions League on Wednesday, now tops the goal chart in that competition with three goals in two games – level with Kylian Mbappe and Robert Lewandowski.
In the Premier League, the 22-year-old has netted 10 goals from just six Premier League games, and has also been substituted early in all but one of those to miss 55 minutes – netting back-to-back hat-tricks during wins over Crystal Palace and Nottingham Forest at the Etihad.
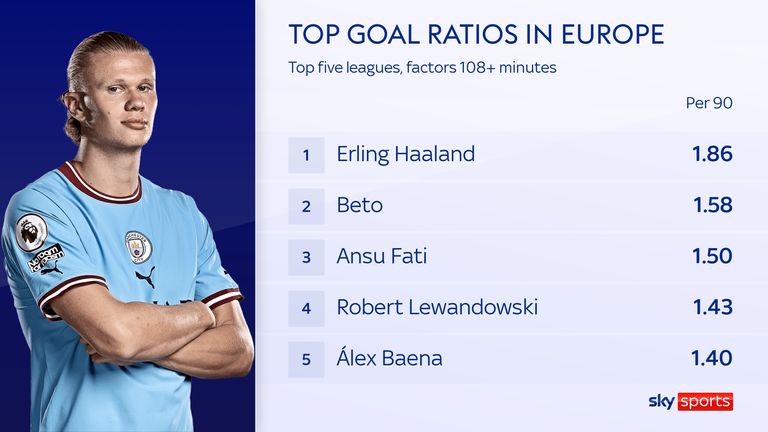
Those numbers produce a staggering league ratio of 1.86 goals per game – more potent than any other player in Europe’s top five leagues this season to have played in excess of 108 minutes.
The chart below plots goals and expected-goal returns for all Premier League players this season and presents the scale of the striker’s early form – soaring clear in both categories.
Several forwards from opposition teams are in consistent form, most notably Aleksandar Mitrovic, Ivan Toney, Harry Kane and Wilfried Zaha – but Haaland is doubling, and humbling, those figures.
Some critics might claim that any established forward would convert bags of goals in Pep Guardiola’s side, based on the sheer quantity of clear-cut chances they create.
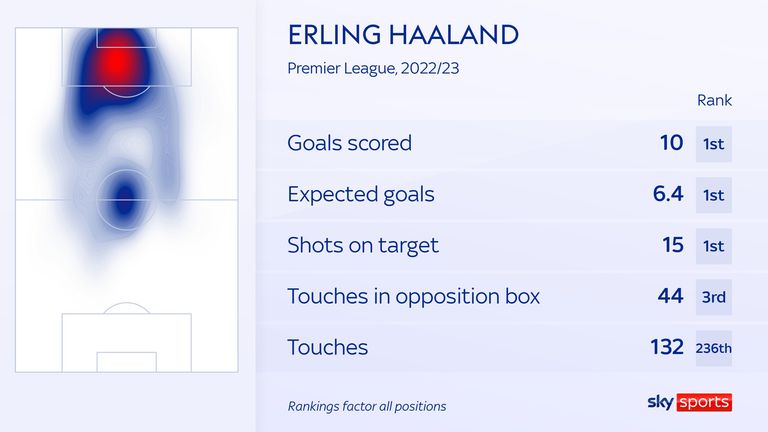
However, the Norway international has also nearly doubled his xG returns, netting almost four goals more than the 6.4 expected from chances presented to him – another league-topping ratio.

Additionally, Haaland has fired a league-high 15 shots on target, which means his current goal haul equates to one goal from every 1.5 shots on target – underlining the clinical finishing to date.
The shot map below highlights City’s new No 9 has converted six of his haul from poaching opportunities inside the six-yard box, with another four coming from between the six- and 18-yard lines – while all goals were fired from the central third of the opposition box.


